Summary
The IoT Open Grafana connector currently only exposes the "Current state only" and "As table data" toggles for data queries. It lacks support for the aggregation parameters (aggr_method and aggr_interval) already available in the IoT Open v3beta Log API, leaving a significant capability gap between what users can do on the IoT Open platform and what they can visualize in Grafana.
Current Behavior
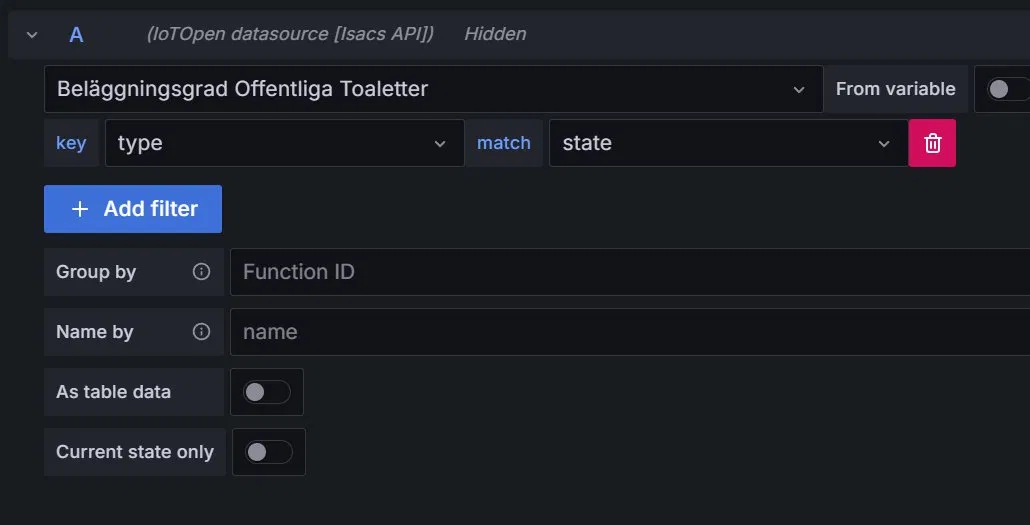
When configuring a datasource query in Grafana using the IoTOpen connector, the available options are limited to:
- Dataset / installation selection
- Key/type filter
- Group by (Function ID)
- Name by
- As table data (toggle)
- Current state only (toggle)
There is no way to specify an aggregation method or a time interval for downsampling, forcing the connector to always return raw, unaggregated data points.
Why Not Just Use a Generic Connector?
Other Grafana datasource connectors, such as the Infinity plugin, can technically reach the IoT Open v3beta log API. However, they require the user to hard-code from and to as static values directly in the query URL. This breaks the fundamental Grafana contract: the dashboard's time range picker and zoom controls no longer drive the query, making the panel static and unusable for interactive exploration or any dashboard that needs to reflect a dynamic time window. The IoTOpen native connector handles time range binding correctly today - the ask is simply to extend that working foundation with aggregation support, rather than forcing users onto a workaround that sacrifices Grafana's core time navigation.
Desired Behavior
The connector should expose the aggr_method and aggr_interval query parameters supported by GET /api/v3beta/log/{installation_id}, so that users can configure aggregation directly in their Grafana panel queries just as they can on the IoT Open platform itself.
API Reference
The underlying API already fully supports this. The relevant parameters on GET /api/v3beta/log/{installation_id} are:
aggr_method one of:
count, first, last, avg / mean, spread, max, min, sum, stddev, median, percentile(X), integral(X)
aggr_interval —a duration string such as 1m, 10m, 1h, 6h, 1d
When no interval is specified, the API auto-selects one based on the queried time range (e.g., 6h for >364 days, 1h for >27 days, etc.).
An example request demonstrating daily sum aggregation of an occupancy sensor:
GET /api/v3beta/log/1682
?from=1767222000
&to=1798757999.999
&topics=obj/lora/24e124617e263442/occupancy
&aggr_method=sum
&aggr_interval=1d
This is the exact query the IoT Open platform itself issues when viewing a sensor graph with "Sum / 1d" aggregation (as shown in the attached screenshot).
Proposed Connector Changes
- Add an Aggregation Method dropdown to the query editor, listing all methods supported by the API (
none / raw, sum, avg, min, max, count, first, last, spread, stddev, median, percentile, integral).
- Add an Aggregation Interval input field accepting duration strings (
1m, 10m, 1h, 6h, 1d, etc.), ideally with a sensible set of presets matching Grafana's native time grouping conventions. An "Auto" option that omits the parameter and defers to the API's auto-selection logic would also be valuable.
- When an aggregation method is selected, pass both
aggr_method and aggr_interval as query parameters to the v3beta log endpoint.
- When Grafana's native
$__interval variable is available, consider mapping it to aggr_interval automatically in "Auto" mode to align bucket sizes with the dashboard's zoom level.
Why This Matters
Without aggregation support in the connector, Grafana users must either fetch thousands of raw data points and rely on Grafana's own less efficient client-side transformations, or resort to workarounds that break native time range navigation. Use cases like daily occupancy totals, hourly energy consumption, or weekly averages all trivially achievable on the IoT Open platform are unnecessarily difficult to replicate in Grafana dashboards today.
Attachments
Screenshot 1: IoT Open platform graph view showing Sum / 1d aggregation working correctly on a real occupancy sensor 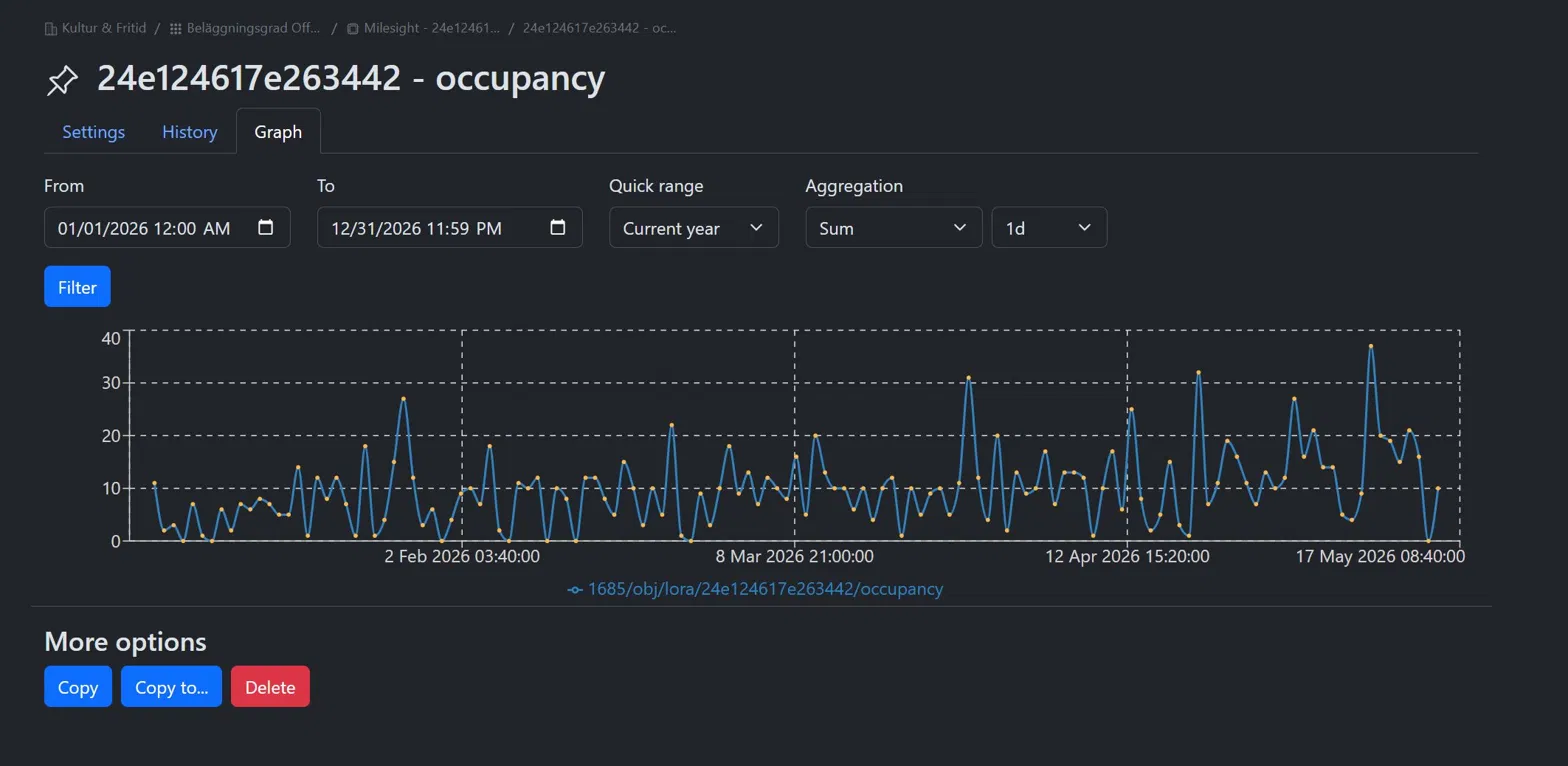
Screenshot 2: Current IoTOpen Grafana connector query editor, showing the absence of any aggregation controls