Since Grafana 9.1 there is a new feature to make dashboards public. It has to be enabled in the Grafana-installation in order to work. There are two parameters needed to be set:
GF_FEATURE_TOGGLES_PUBLICDASHBOARDS=enabled
GF_AUTH_ANONYMOUS_ENABLED=true
To start Grafana in Docker to test, use this command:
docker run -p 3000:3000 \
-e "GF_INSTALL_PLUGINS=https://github.com/IoTOpen/grafana-datasource-lynx/archive/3.0.0.zip;iotopen-datasource" \
-e "GF_PLUGINS_ALLOW_LOADING_UNSIGNED_PLUGINS=iotopen-datasource" \
-e "GF_FEATURE_TOGGLES_PUBLICDASHBOARDS=enabled" \
-e "GF_AUTH_ANONYMOUS_ENABLED=true" grafana/grafana
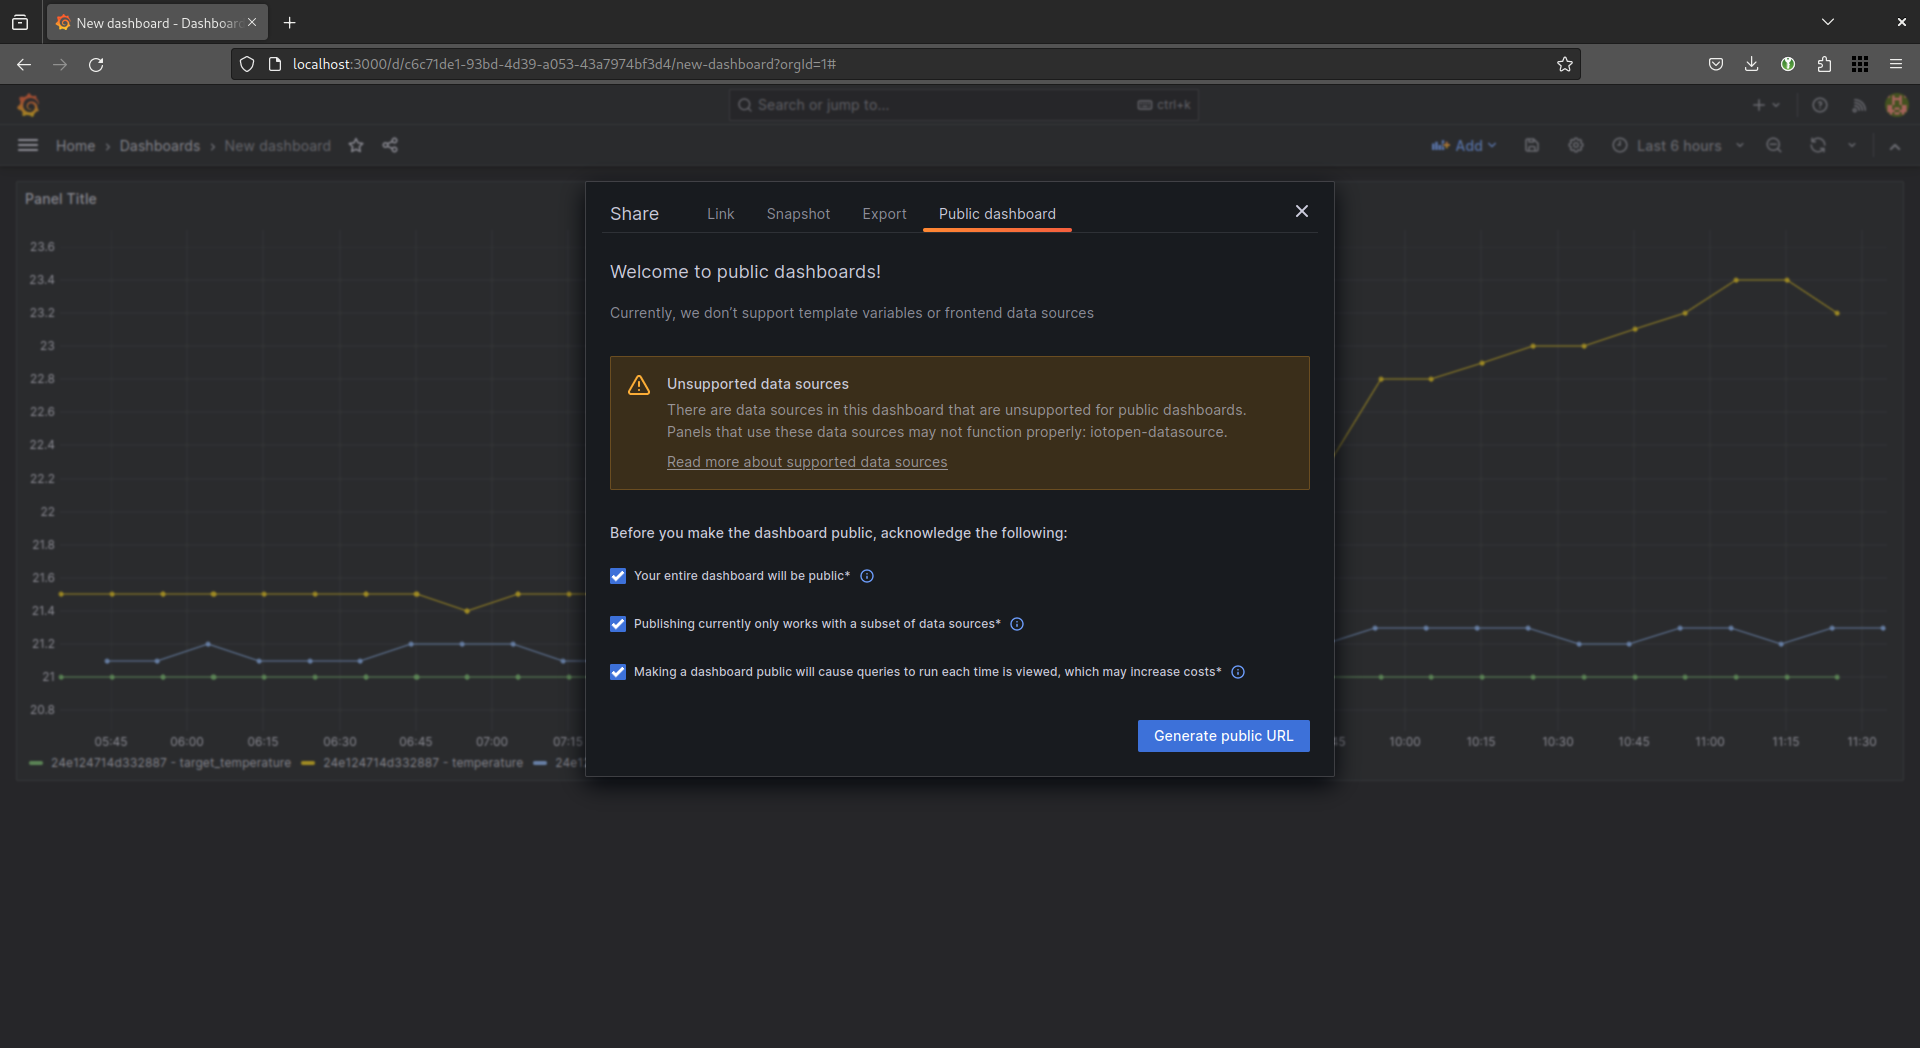
Now on the share Icon from the dashboard, there is a tab called "Public dashboard" were you can create a public link to the dashboard. There is a warning about iotopen-datasource, but you can safely ignore that.
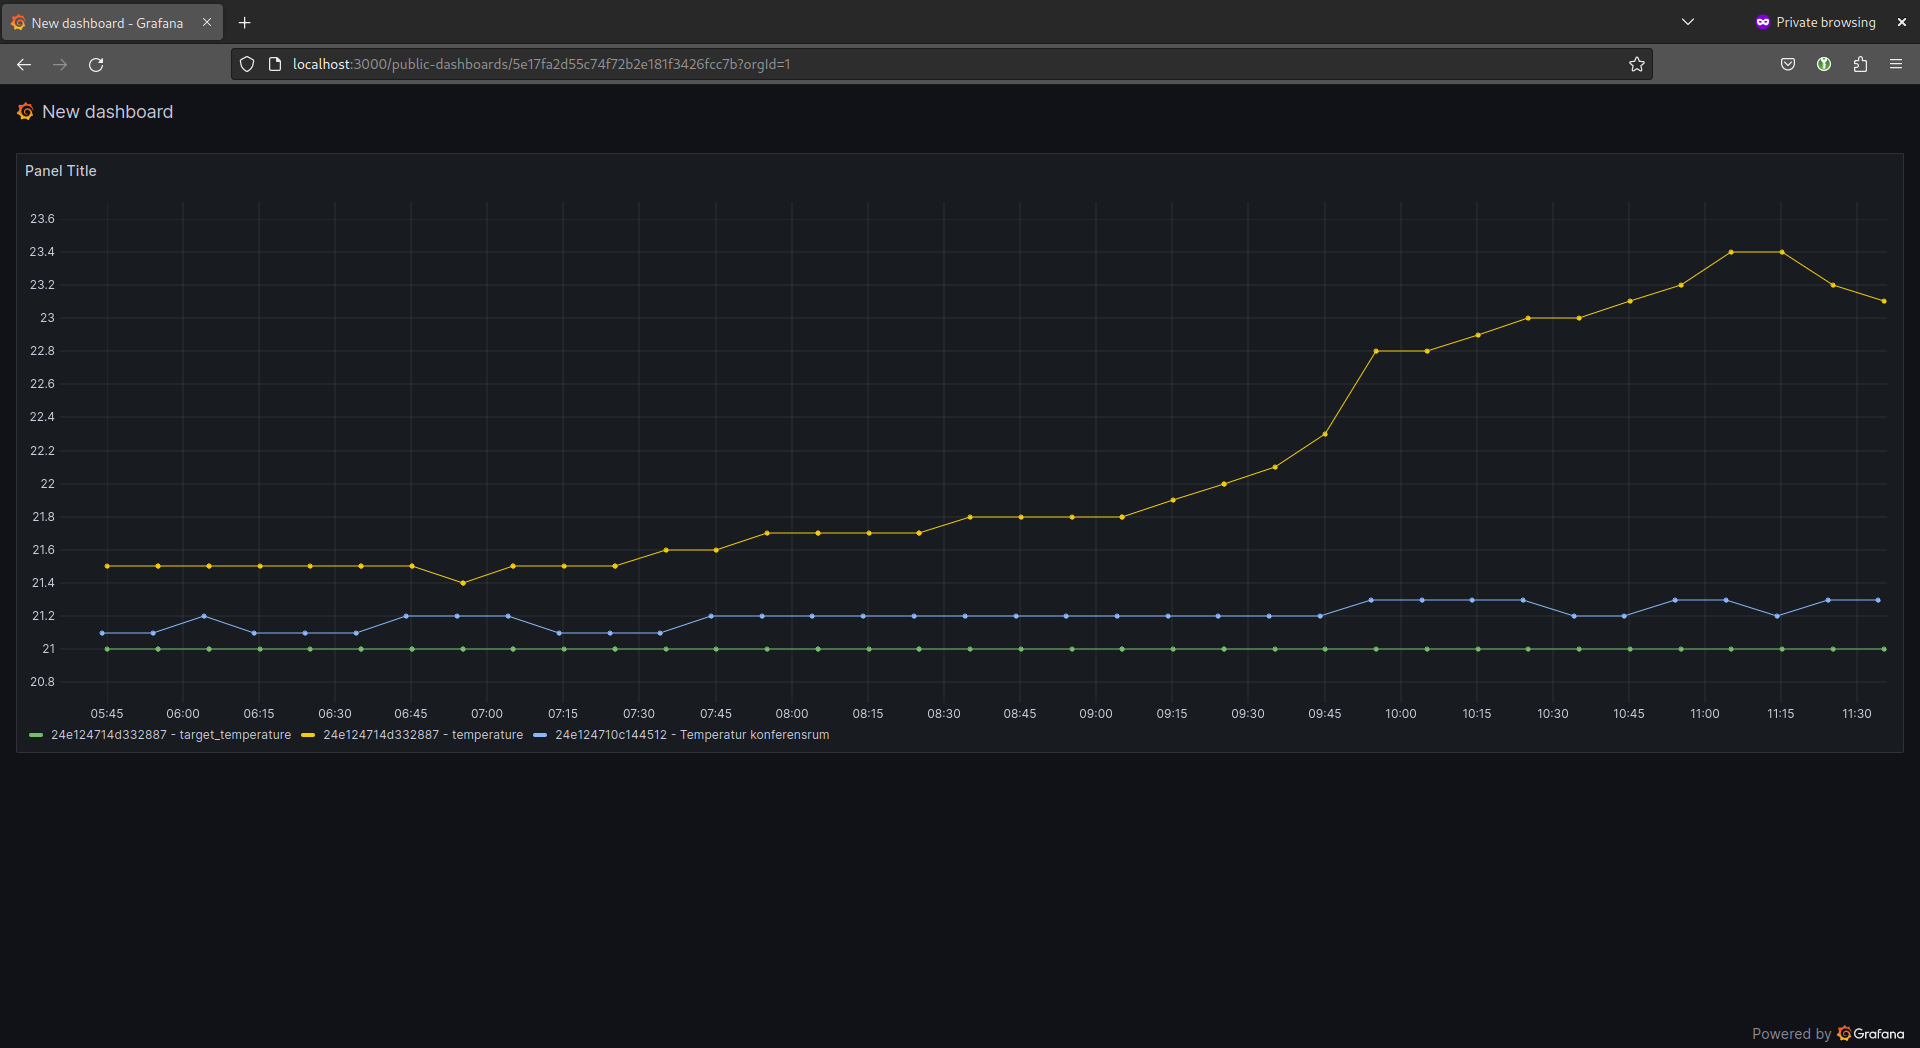
When you are not authenticated and open that url the dashboard is shown in read-only mode.
Good luck with your public dashboards!