Background
IoT Open is a generic IoT platform for any IoT application. There are several integrations to IoT Open that is in use in large applications.
Grafana is a powerful application for visualizing data in graphs and other widgets. It can handle a large number of data sources including IoT Open.
Variables
In Grafana data visualization is collected in dashboards. Each dashboard man contain several widgets, called panels. Sometimes the Dashboards get quite complex and may contain many panels. There are some global variables always available, like time period. When the time period is changed it affects all panels (unless otherwise is set in the panels).
It is also possible to define your own global variables. For instance if you have hundreds of installations with the same sensors, then you can create one dashboard and define a installation variable and choose installation there instead of defining one dashboard for every installation. Or let's say you have thousands of sensors of the same type and you have a dashboard for one of them, you can use a variable to choose sensor and use one single dashboard for all the sensors.
Of course you can choose variables to define any type of input data if you use them in a smart way.
Getting started
Let's start by defining a simple variable.
In this case I'll work with an installation with temperature, air pressure and humidity from different cities in Sweden. I have also defined a meta-data called "Region" with what part of Sweden the sensor is located.
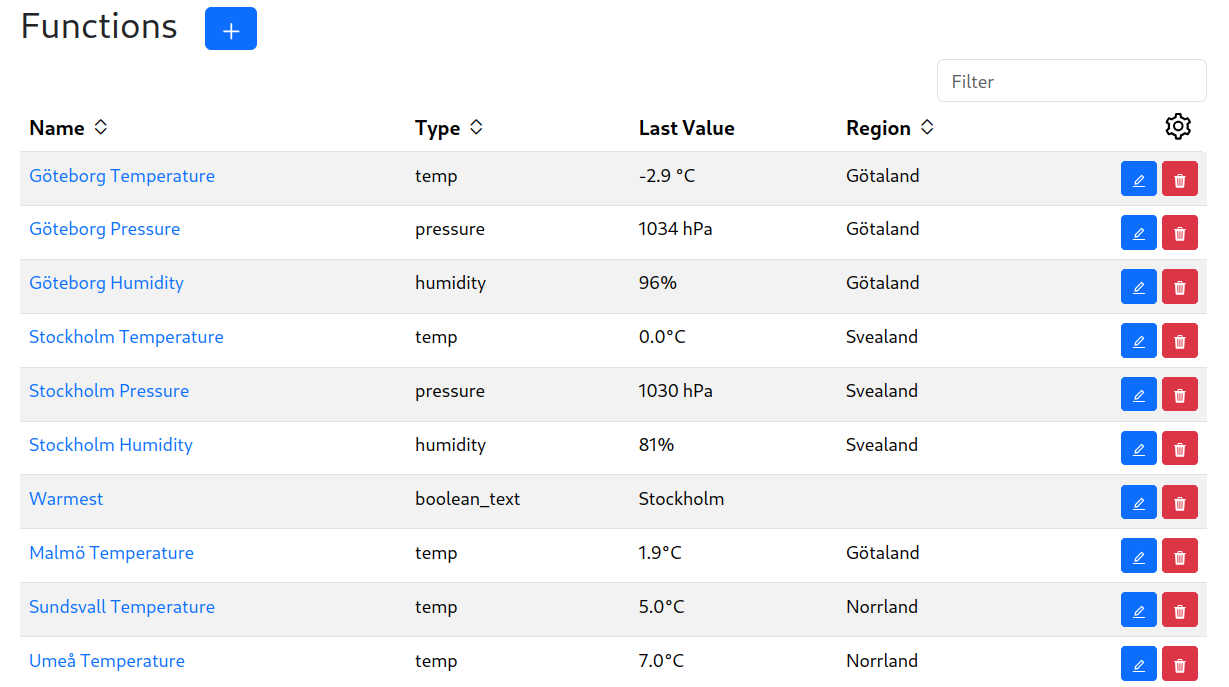
Now let's create a dashboard with region as a variable.
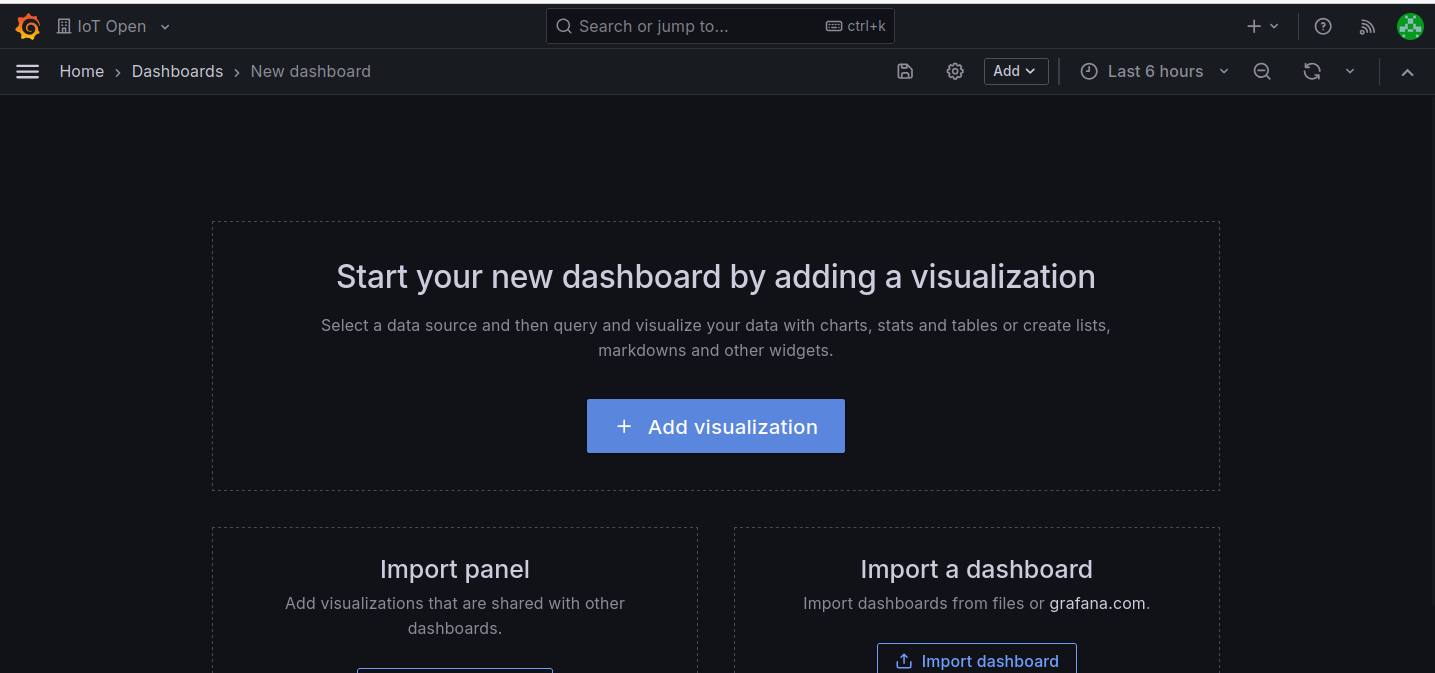
Start by creating a new dashboard.
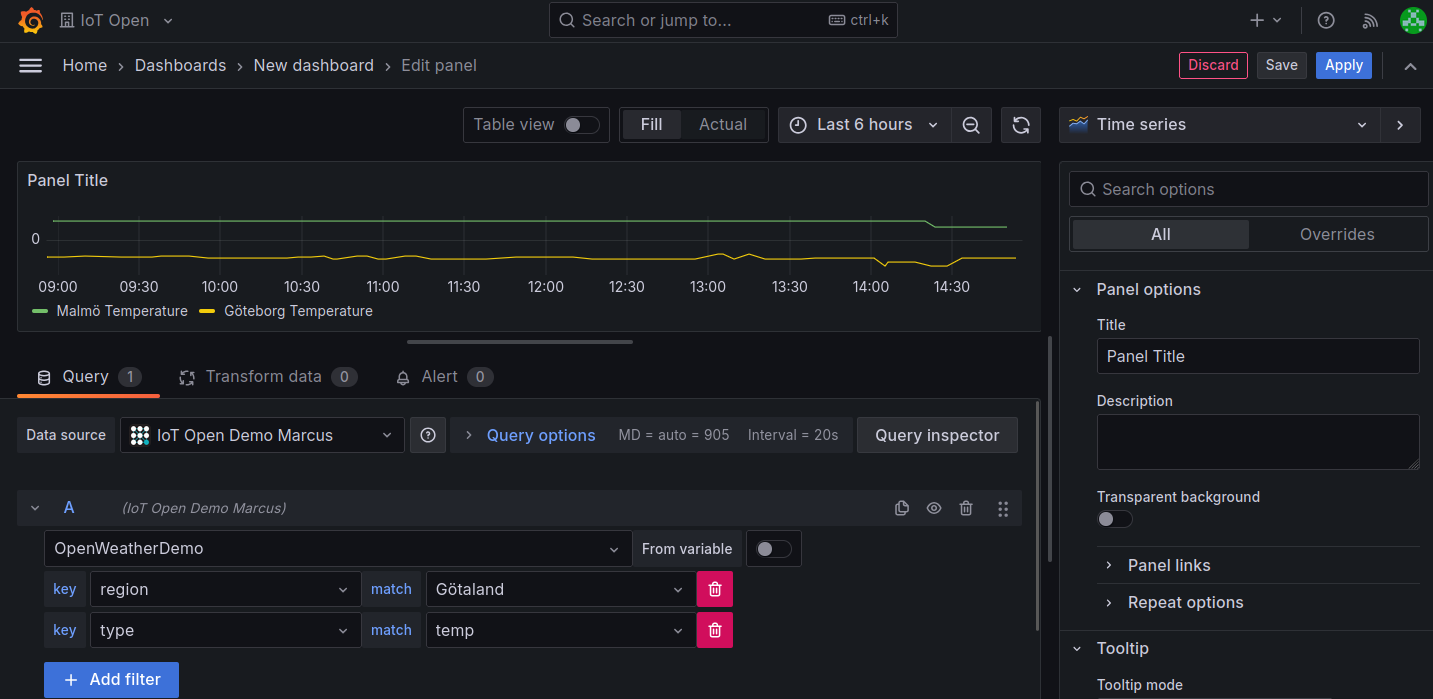
I think it is easiest to create a dashboard without the variable at first. I created three graphs, one for each measurement and I chose region = "Götaland".
The resulting dashboard looks like this:
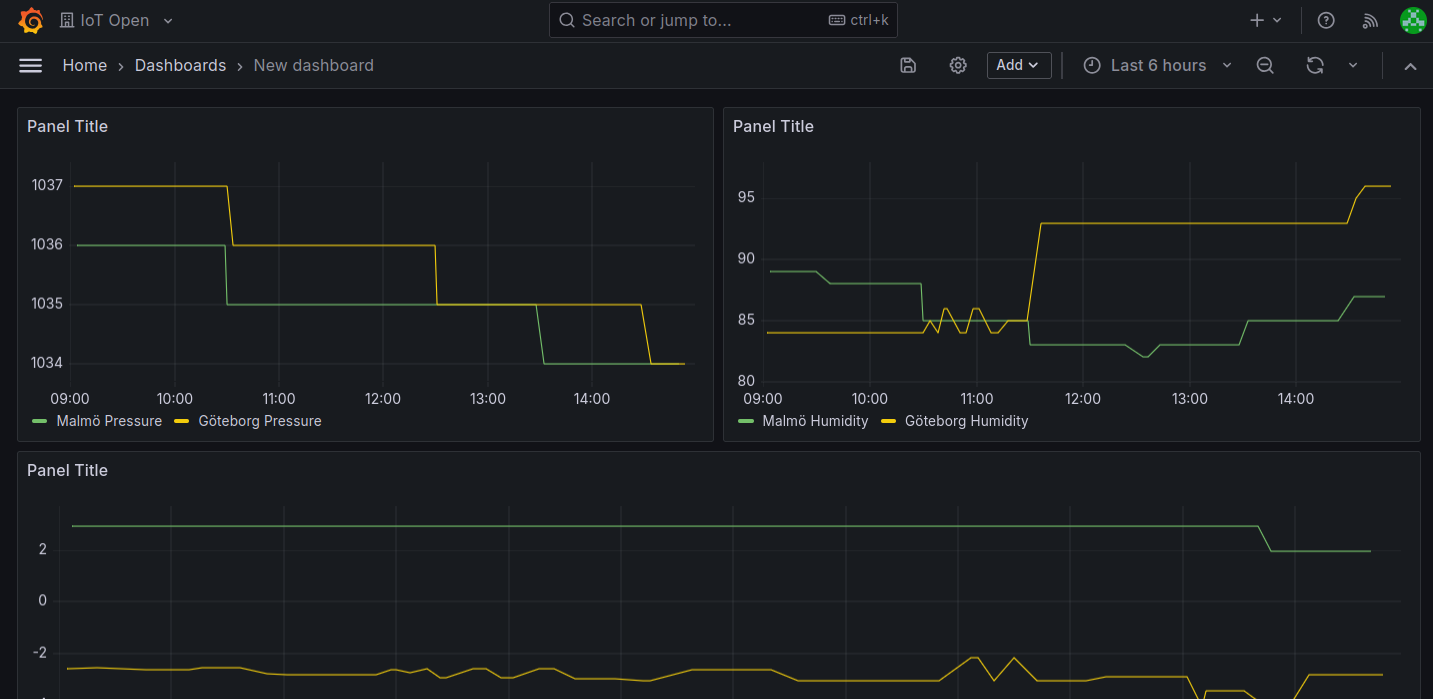
The dashboard shows all values from the sensor but only for "Götaland". If I want a dashboard for "Svealand" and "Norrland" to I could make three copies of it and change the region in all three panels. But if it was 100 regions? So let's make a variable called "region" and use that one instead.
Press the cog on the top menu of the dasboard and choose the Variables tab.
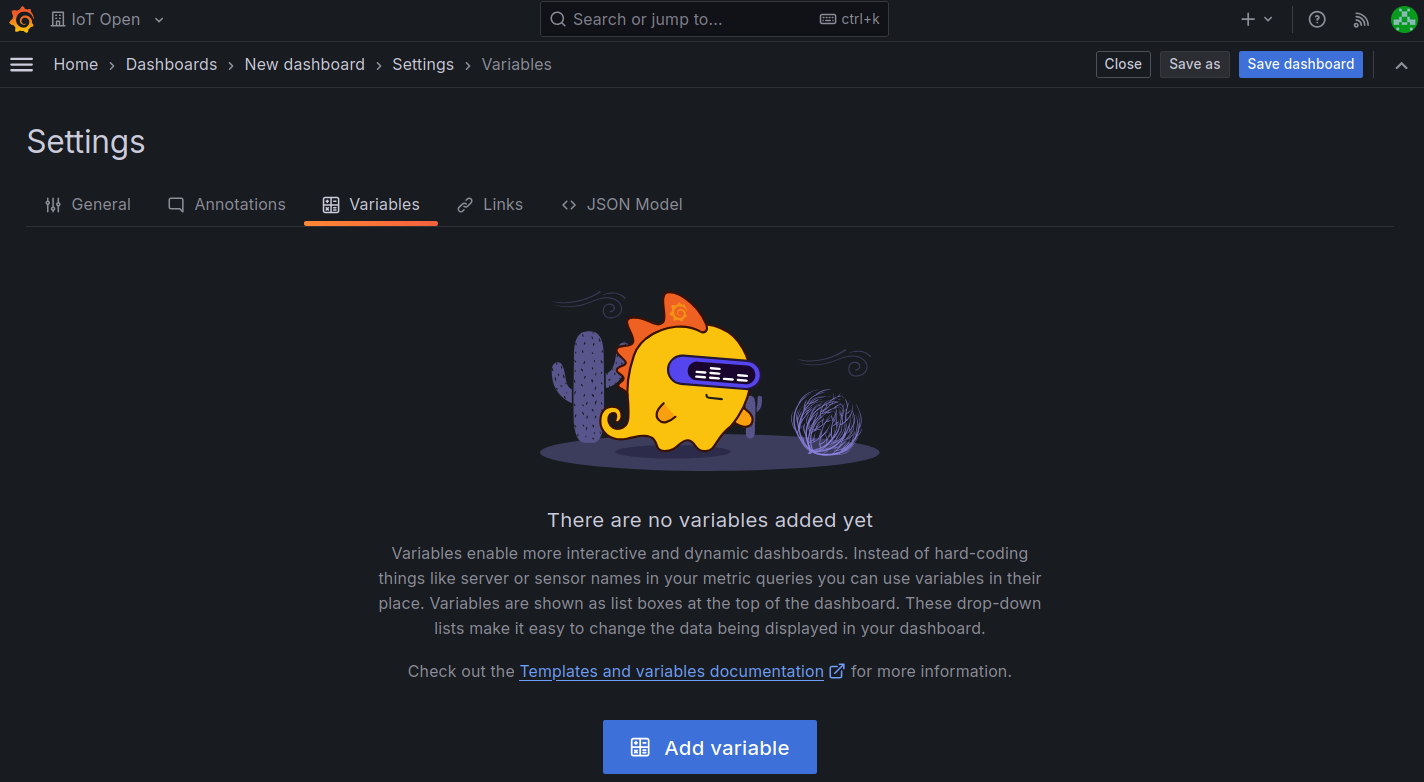
Click on "Add variable to get started".
You can create several types of variables. In my case with only three options I could create a "Custom" variable but if there were hundreds that would not be a good option. So I'll chose "Query".
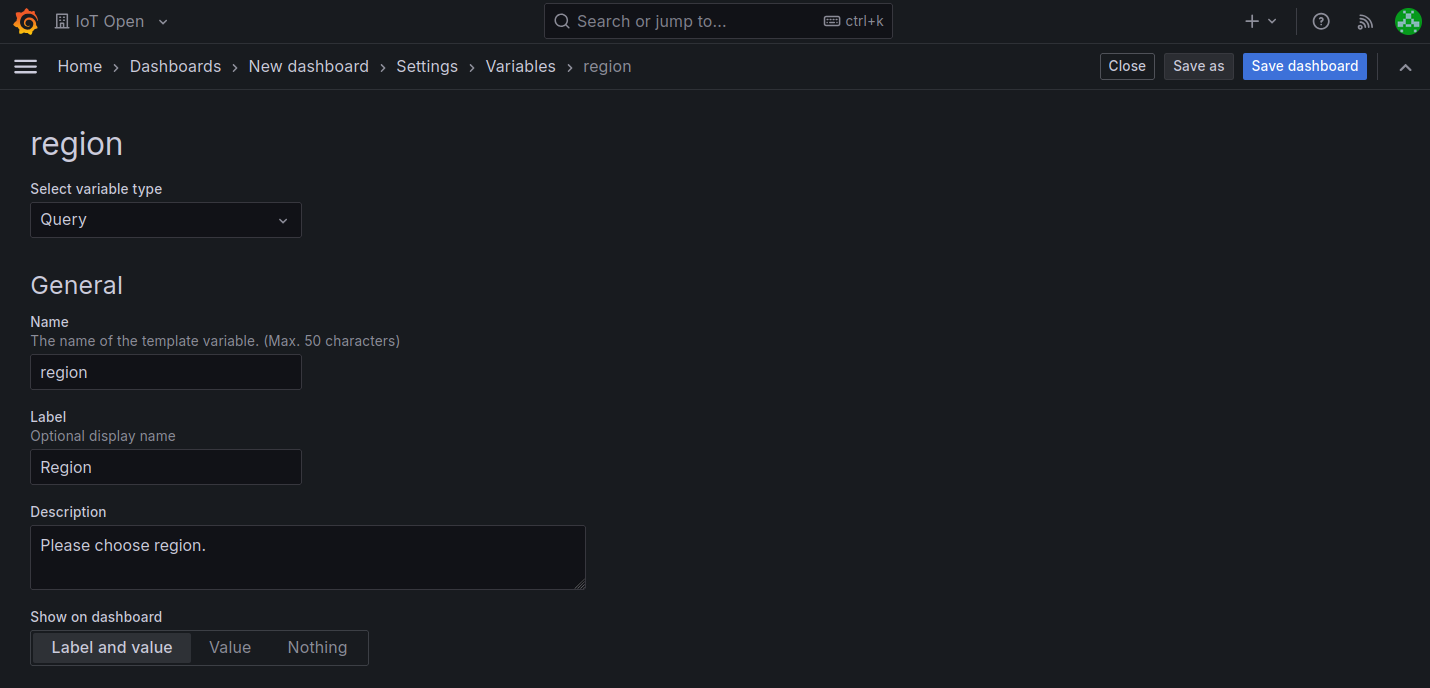
I'll call the variable "region" since that is what it will represent. I give it a label that I also call region but with a capital first letter and a small description. Please do what suits your application. The first half of the configuration now looks like this:
Then I chose what data source to use and if I chose an IoT Open data source I can also choose an installation that I have to write in the id of manually and also what metadata to use. In my case the installation is id 4 and the metadata I want to use is "region". Note that at the bottom there is a preview of the values. You can also chose to sort them if you like.
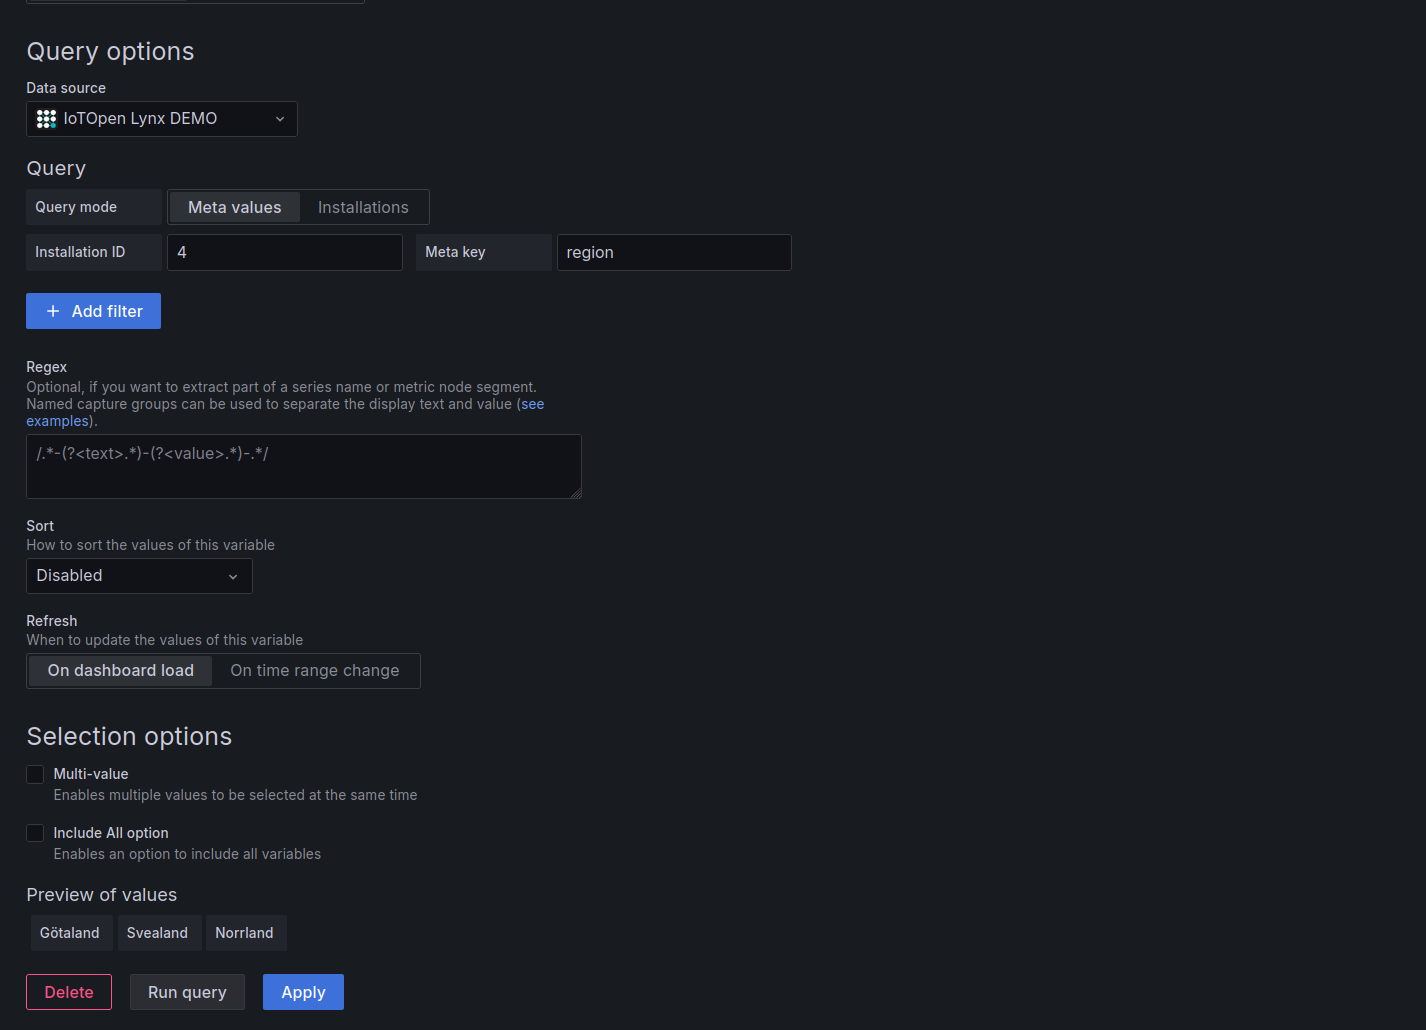
Then you are done with the settings. Save them and go back to your dashboard. Now you will have a selector at the top of your dashboard.
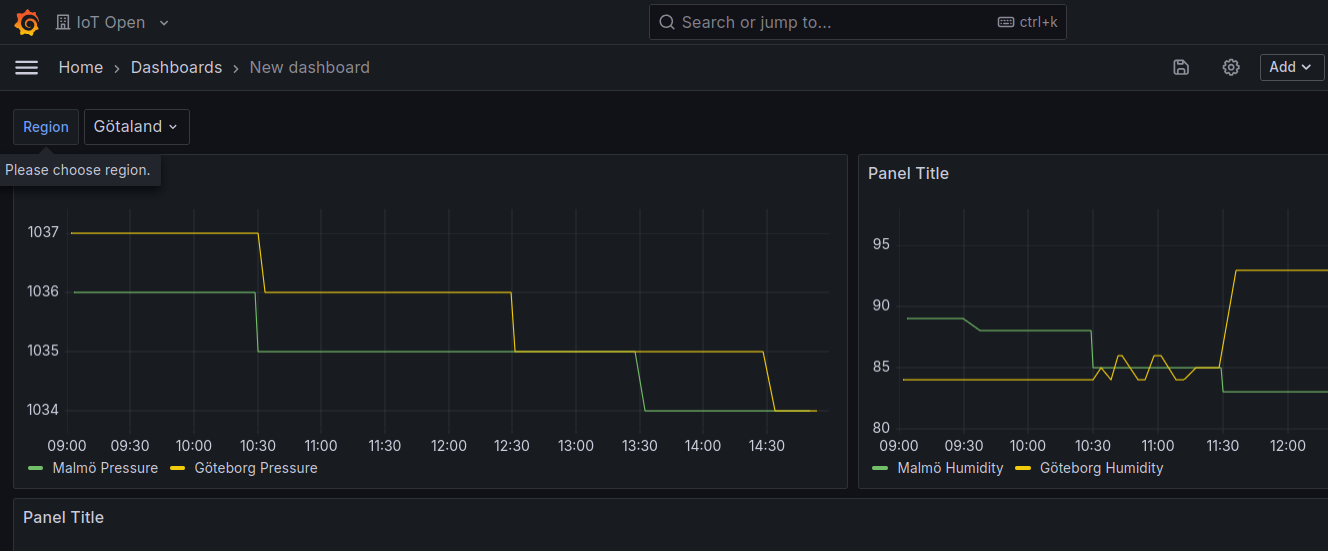
But if I change the region in the selector nothing happens. This is because the panels don't use the variable yet. To make use of it you reference it like $variable_name in your panels. In my case $region.
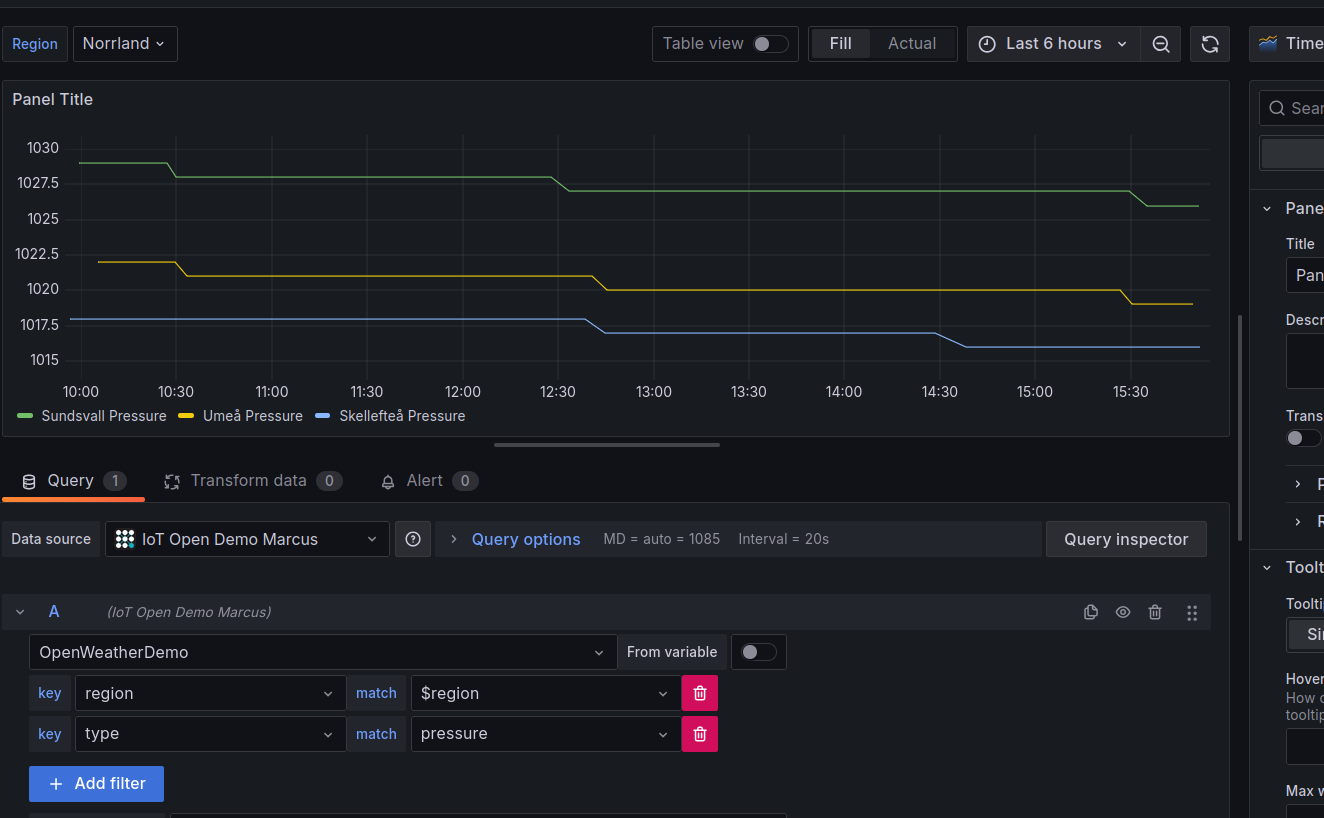
And when I have done that in all panels I can change the region for the whole dashboard in one go by using the drop down at the top.
It is also possible to do this for the installation. Then you have to use the "From variable" switch next to the installation selector. And as I sad in the beginning of the text, you can also use custom variables. Please feel fre to elaborate.
Comment and ask questions below 😄