Hi Timi!
There are two things that is easiest to miss.
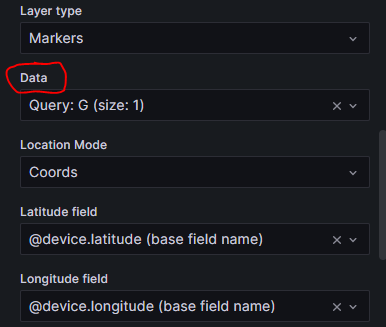
1 In order to see the device in Grafana, there needs to be a function related to it and it needs to have at least one datapoint. (Grafana currently works primarily with data through functions).
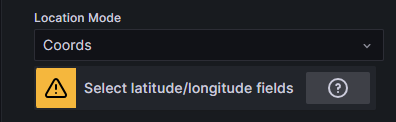
2 The metadata is a string from IoT Open, To use it as a position you have to convert it to a number.
How to do it.
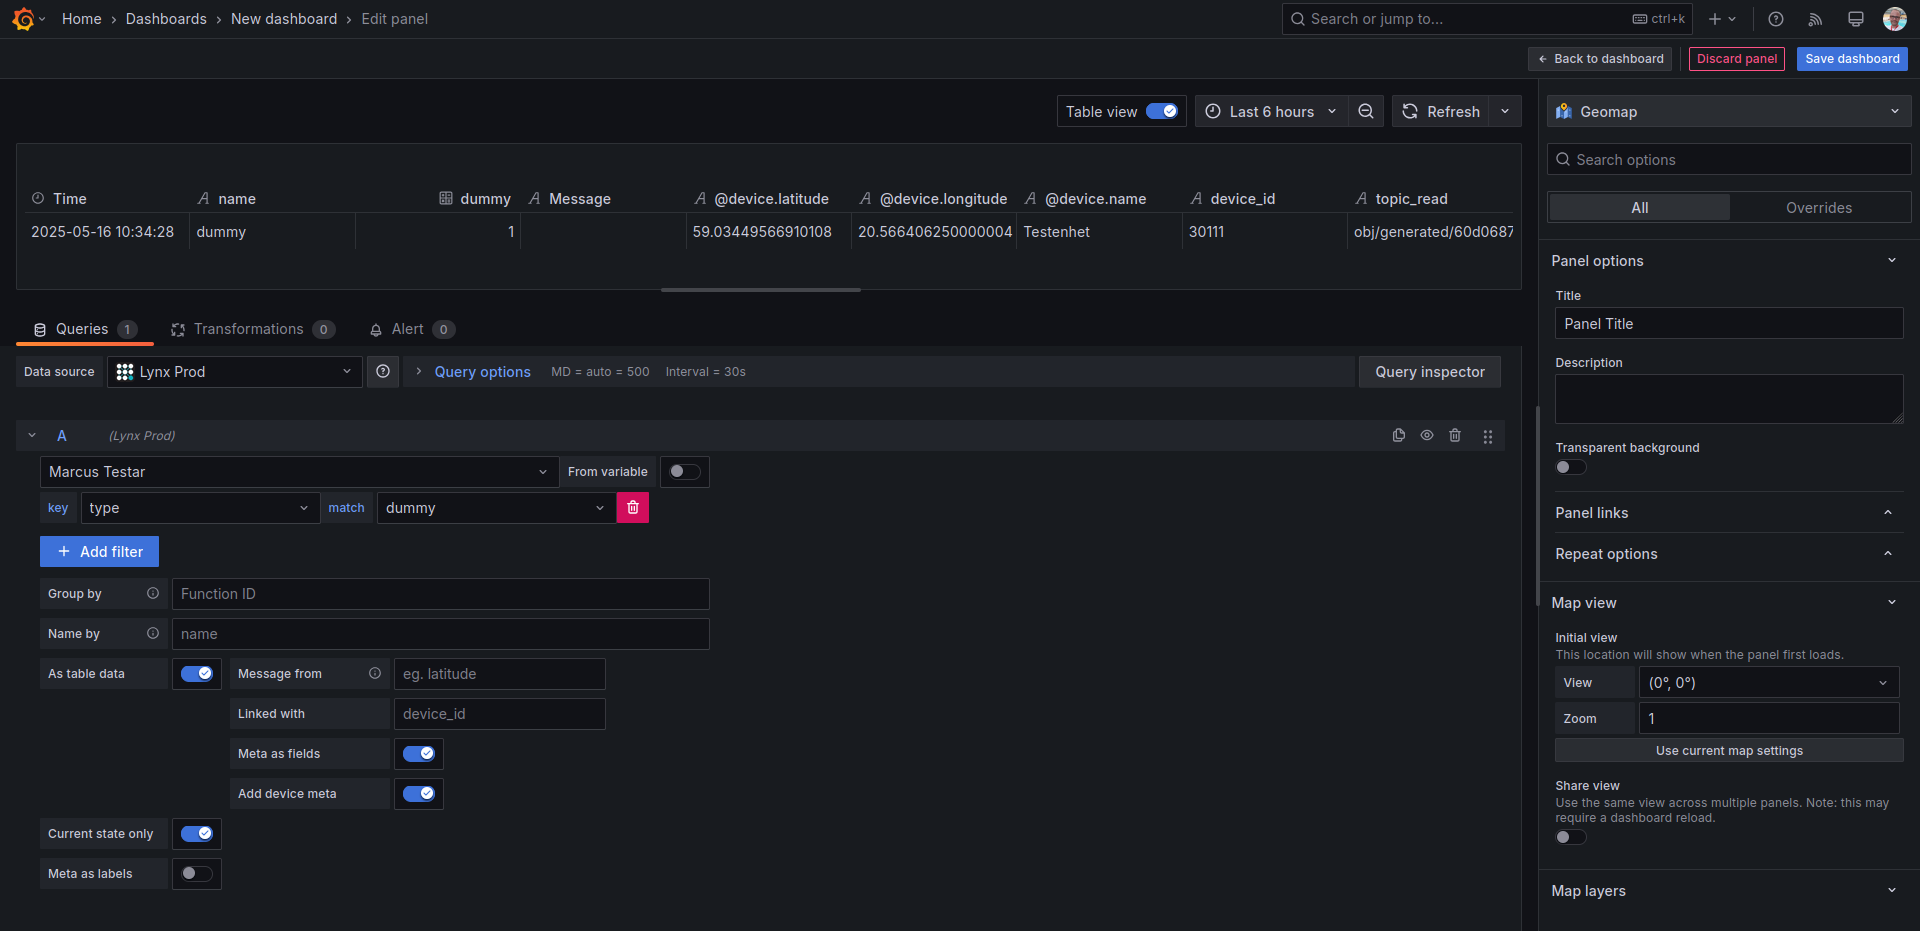
Make sure the device have at least one function. If not, create a dummy function and send some random data to it with the mqtt-tool. In Grafana choose the installation and any function from the device. I use a dummy function. Make sure that "current state only" is checked if you want the device to be always visible regardless of the time span of the dashboard.
In the image below you can se that I have chosen the Geomap panel and my dummy function. In the table view we can see the lat/long from the device.
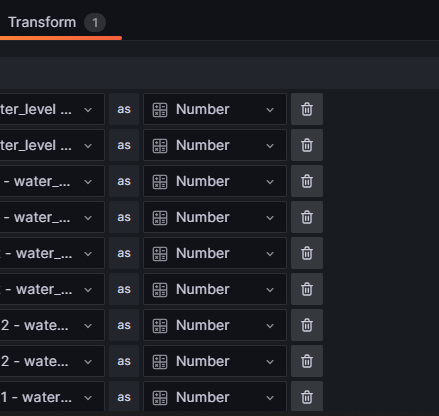
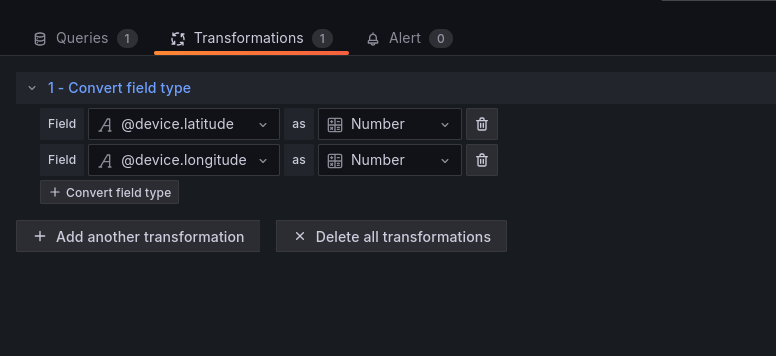
The thing is that these numbers are strings, so I have to transform them to numbers. Add a transformation called "Convert field type" and select the lat and long fields and number:
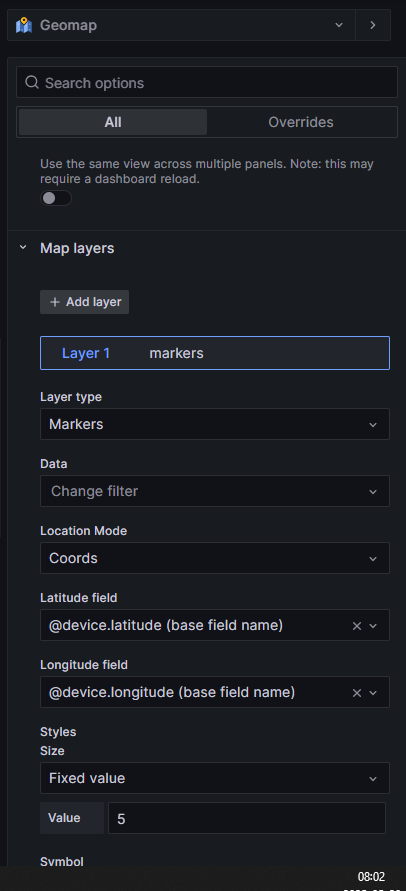
Now it is ease to chose them in the panel configuration:
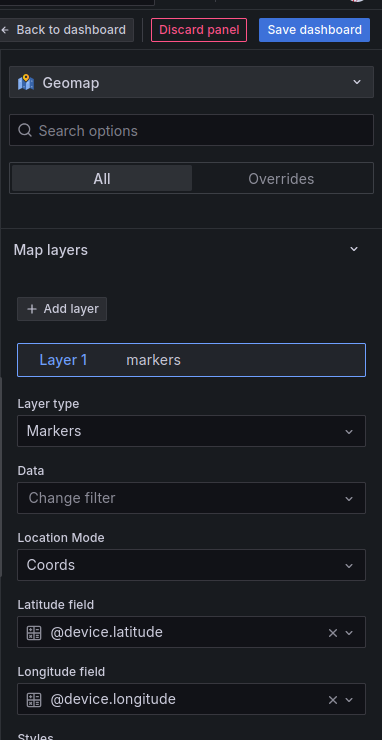
Then your device pops up the map. This works also for many devices as well a single one. Just make sure the selection of functions is correct.
Then there is a lot of tweaking you can do with the map and what data do show but I'll leave that for you to discover.